8th July 2025
Best and Worst LPAs for planning appeals
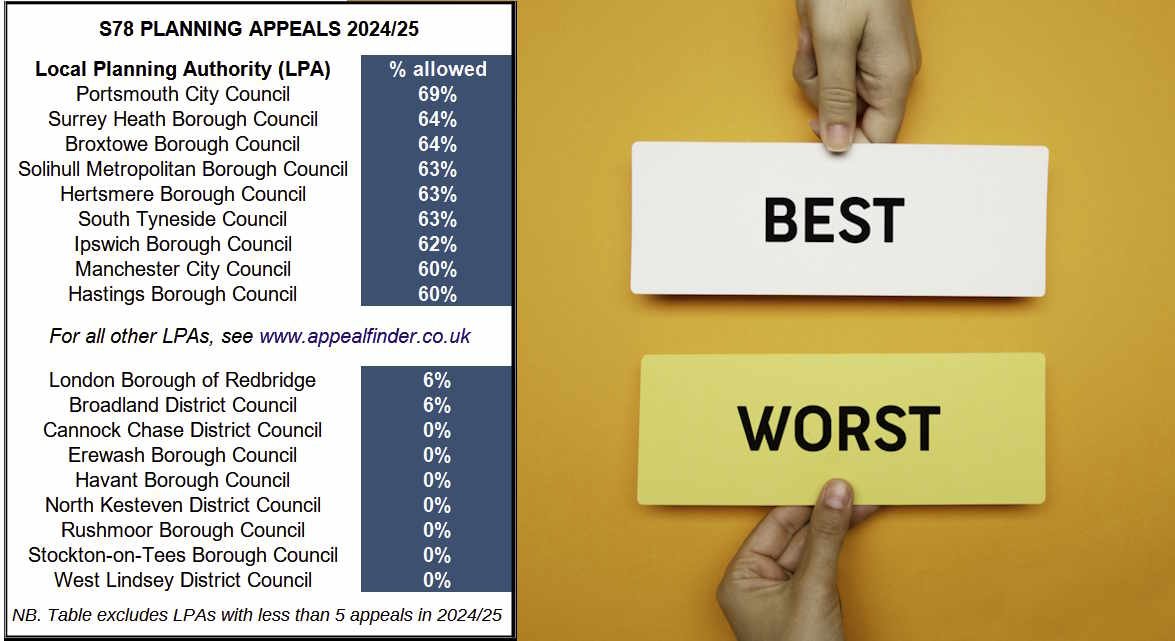
Appeal success rates for 2024/25 are now available by local planning authority and by Inspector. The best and worst LPAs for the top and dunce prizes for s78 appeal performance are shown in the table below:
But wait - each appeal is unique so while the overall % of appeals allowed is interesting, it doesn’t tell you how your case will go. You knew that already. So what is your real reason for peaking at the figures?
To help manage client expectations? For a morale boost? For reassurance that it isn’t just you who finds planning frustrating? As Churchill said, "Success is not final, failure is not fatal: it is the courage to continue that counts." Take courage!
When interpreting the statistics, do remember:
- a larger number of appeals decided provides more reliable statistics than a few appeals (<10).
- appeals reflect the mix of local development, for example, a suburban LPA with a lot of householder development has a different balance of appeals than a highly rural LPA.
- it’s not unexpected for a small LPA like Carlisle to have fewer appeals than a larger LPA like Birmingham, for example. But a small LPA with a large number of appeals should be a red flag.
- last year’s performance may differ significantly to this year’s performance, if the LPA has different officers, policies or approach.
